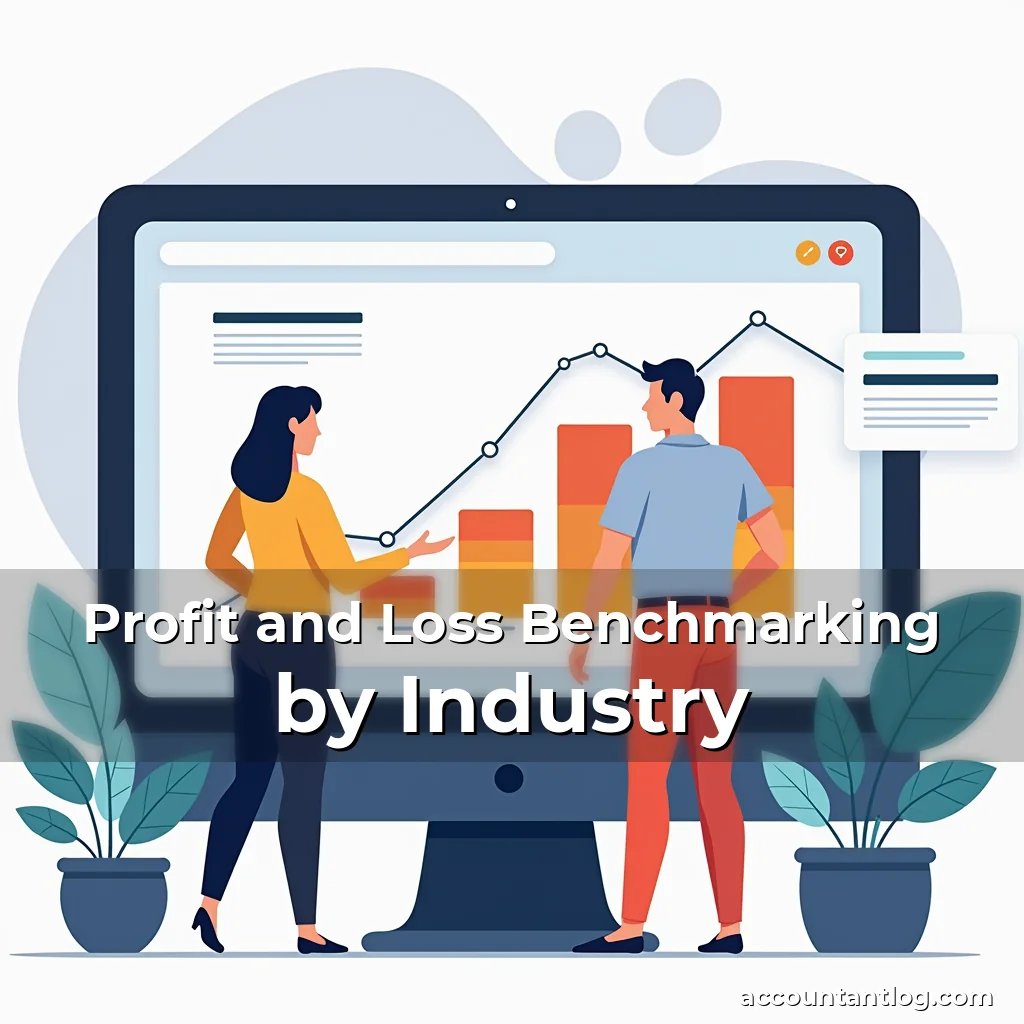
Profit and Loss Benchmarking by Industry
The profit and loss statement serves as a vital diagnostic tool for businesses across industries, revealing key financial health metrics through revenue recognition, expense management, and net income trends. By analyzing industry-specific benchmarks, accountants can identify performance outliers and provide strategic recommendations tailored to their clients’ operational contexts.
Understanding how different sectors manage profitability requires nuanced analysis beyond general accounting principles. This exploration delves into sector-specific P&L dynamics, examining gross margin variances, operating cost structures, and tax implications that shape financial outcomes for service firms versus manufacturing entities.
Core Components of Profit and Loss Statements Across Industries
Every company’s profit and loss statement follows a standardized structure while reflecting distinct industry characteristics. The foundational elements include revenues from primary operations, direct costs associated with goods sold, and overhead expenses that support business functions. These components form the basis for calculating gross profit margins and operating efficiencies specific to each vertical.
In the technology sector, revenue streams often stem from subscription models rather than product sales. Software-as-a-service companies record recurring revenue over contract periods, creating unique amortization patterns compared to traditional manufacturing enterprises that recognize income at time of sale. This distinction significantly impacts cash flow projections and working capital requirements.
Manufacturing firms typically report higher raw material costs as a percentage of total expenses due to inventory management complexities. Their cost of goods sold figures are influenced by production volumes, supply chain disruptions, and commodity price fluctuations. In contrast, professional services firms incur fewer physical assets but face variable labor costs based on billable hours worked.
- Gross Margin Analysis: Retailers usually maintain lower gross margins (typically 20-40%) due to high competition and thin pricing power, whereas software companies often achieve gross margins exceeding 80% thanks to low marginal costs after initial development.
- Operating Expense Trends: Financial institutions allocate significant portions of revenue to compliance, risk management, and technology infrastructure, creating wider operating leverage effects than seen in most other industries.
Healthcare providers operate under unique regulatory frameworks affecting their P&L statements. Mandatory insurance reimbursement rates, clinical staffing costs, and equipment depreciation schedules create distinctive financial profiles that differ substantially from typical corporate balance sheets.
E-commerce platforms exhibit hybrid characteristics combining retail and tech attributes. Their P&Ls reflect both product distribution costs and digital platform maintenance expenditures, requiring careful segmentation when benchmarking against pure-play competitors in either category.
Differential Impacts of Operational Structures on Profitability Metrics
Businesses organize operations using diverse structural models that directly influence their profit and loss profiles. The choice between centralized vs decentralized operations affects cost allocation methodologies and interdepartmental transfers recorded within financial statements. These decisions have cascading effects on reported profitability ratios across different organizational hierarchies.
Firms employing vertical integration strategies often show consolidated P&L entries covering upstream suppliers and downstream distributors. For example, an automotive manufacturer controlling its own steel mills would report integrated production costs differently than a carmaker sourcing materials externally from independent vendors. Such consolidation impacts gross margin calculations and asset turnover ratios.
Franchise-based organizations present another unique case study. While individual franchisee units may generate standalone P&L reports, the parent corporation tracks aggregated data including royalty fees, advertising contributions, and shared administrative expenses. Properly distinguishing these financial flows is crucial for accurate intercompany reporting.
Companies utilizing subcontractor networks instead of full-time employees experience fluctuating wage-related expenses depending on project timelines. Construction firms, for instance, might show erratic personnel costs during off-season months compared to stable employment patterns observed in healthcare facilities providing continuous care services.
Geographically dispersed operations introduce currency conversion challenges affecting multi-national corporations’ P&L statements. Exchange rate volatility between local markets where subsidiaries operate and the parent company’s home currency creates additional complexity in consolidating global financial results.
Industry-Specific Gross Margin Variations
Analysis of gross margin percentages reveals striking differences across economic sectors, shaped primarily by production processes and input cost structures. Retail chains generally operate with narrow gross margins due to intense market competition and fixed rental agreements with landlords. Conversely, extractive industries enjoy wide margins because of limited direct operational inputs once resources are secured.
Petroleum refining companies demonstrate remarkable gross margin consistency despite volatile crude oil prices. This stability arises from their ability to lock in long-term supply contracts while maintaining controlled processing costs through optimized refinery operations. Similar patterns emerge in utility sectors where regulated tariffs protect operators from aggressive price wars.
The hospitality industry presents an interesting paradox – while foodservice establishments often carry low margins due to perishable inventory risks, luxury hotels and resorts achieve premium margins through ancillary services like spas and concierge programs. This dichotomy reflects differing customer value propositions within the broader tourism ecosystem.
Professional service firms such as law offices or consulting agencies show decreasing gross margins as they scale up. Unlike manufacturers who benefit from economies of scale, legal practitioners encounter diminishing returns as staff sizes grow since client acquisition costs increase proportionally with workforce expansion.
Pharmaceutical companies display bi-modal gross margin profiles. Generic drug producers typically maintain lower margins due to price pressures from government regulators, whereas innovator firms with patented medications sustain extremely high margins before patent expirations force them to develop new products.
Taxation Considerations in Profit and Loss Analysis
Tax obligations represent a critical component of any organization’s P&L statement, influencing both current liquidity positions and future investment capabilities. Different jurisdictions impose varying tax regimes that affect how profits get recognized and taxed across accounting periods. These regulations require meticulous tracking to ensure compliance while optimizing overall tax efficiency.
Conglomerates operating in multiple countries must navigate complex transfer pricing rules governing transactions between related entities. Failure to properly document arm’s length pricing arrangements could lead to costly disputes with international tax authorities, potentially altering net income figures reported in consolidated financial statements.
Tangible asset depreciation policies also impact taxable income computations. Accelerated depreciation methods allow certain businesses to reduce near-term tax liabilities, although this strategy might compromise long-term financial flexibility by understating replacement reserve funds. Real estate developers particularly benefit from enhanced deductions tied to property improvements.
Income tax credits available for research and development activities offer substantial benefits to tech-driven industries. Eligible companies can claim refunds or reduced tax payments for qualifying expenditures, which must be carefully documented and audited to avoid disqualification issues during tax assessments.
Service-oriented businesses frequently encounter difficulties in determining appropriate revenue recognition timing for tax purposes. With increasing emphasis on accrual accounting standards, discrepancies may arise between GAAP-based financial reporting and IRS-approved treatment of deferred revenue items.
Operational Efficiency Indicators Derived from P&L Data
Examination of profit and loss statements provides access to numerous operational efficiency indicators essential for performance evaluation. Key metrics include return on sales (ROS), operating leverage multiples, and expense-to-revenue ratios that reveal underlying productivity levels within various organizational frameworks.
Manufacturing enterprises track idle capacity percentages alongside utilization rates to assess plant efficiency. A consistently high percentage of unused machine hours indicates potential process optimization opportunities that could enhance overall profitability without requiring additional capital investments.
Retailers monitor inventory turnover ratios closely, aiming to strike a delicate balance between stock availability and carrying costs. Rapid turnover suggests effective merchandising strategies, while excessively slow rotation might signal poor demand forecasting or inefficient procurement practices.
SaaS companies measure customer acquisition cost (CAC) relative to lifetime value (LTV) metrics. When LTV exceeds CAC by reasonable margins (typically 3:1 or better), it indicates sustainable growth trajectories supported by efficient marketing spend and strong customer retention mechanisms.
Healthcare organizations analyze bed occupancy rates combined with average daily charges to optimize resource allocation. Maintaining optimal bed utilization ensures adequate patient throughput without compromising quality of care, directly impacting both revenue generation and operational expenditure controls.
Seasonality Adjustments in Profit and Loss Forecasting
Accurate interpretation of P&L information demands consideration of seasonal variations inherent in many industries. Tourism-dependent businesses experience cyclical revenue patterns aligned with calendar events, requiring specialized modeling techniques to isolate underlying performance trends from temporary fluctuations.
Construction firms must account for weather-induced delays when projecting annual earnings. Unseasonably cold winters or prolonged rainfall periods can disrupt project timelines, causing unexpected cost overruns that skew quarterly profit figures unrelated to actual operational inefficiencies.
Agricultural enterprises face dual seasonality factors – planting seasons followed by harvesting cycles. Crop yields depend heavily on climatic conditions, making precise financial planning challenging given unpredictable natural forces that impact both input costs and final product valuations.
Consumer electronics retailers witness pronounced pre-holiday spending surges that dramatically boost fourth-quarter revenues. Effective inventory management becomes critical during these peak periods to prevent excess stock accumulation post-holiday slump while meeting heightened consumer demand.
Retail banks observe deposit and loan pattern shifts corresponding to payroll cycles. Increased transaction activity around monthly paydays influences fee income streams and loan origination volumes, necessitating smooth liquidity management across different fiscal quarters.
Actionable Insights for Accounting Professionals
For accounting consultants specializing in P&L analytics, identifying cross-industry comparisons offers powerful tools for advising clients on improvement initiatives. Recognizing divergent profit margin norms allows targeted interventions aimed at enhancing value creation without unnecessary resource reallocation efforts.
When assisting manufacturing clients, emphasizing lean production methodologies can yield immediate cost reductions through waste elimination. However, this approach may need adjustment for firms operating in highly regulated environments where process standardization takes precedence over efficiency gains.
Consulting engagements with e-commerce ventures benefit from highlighting logistics optimization strategies. Streamlining last-mile delivery systems reduces shipping expenses while improving customer satisfaction metrics, directly contributing to improved bottom-line results.
Financial advisors serving professional service organizations should emphasize systematic workload management solutions. Implementing time-tracking technologies helps control billable hour variance, ensuring consistent revenue realization across different engagement types.
Advisors working with hospitality groups must address fluctuating occupancy rates through dynamic pricing algorithms. These tools enable real-time adjustments balancing room availability with demand signals, maximizing revenue without compromising brand reputation.
Engagements involving pharmaceutical firms require attention to R&D pipeline visibility. Tracking phase transitions in drug development processes helps predict future revenue streams, allowing proactive capital allocation decisions regarding facility expansions or personnel hiring needs.
Lastly, helping clients understand tax incentive eligibility criteria remains crucial for maintaining competitive advantage. Identifying applicable credits for green energy initiatives or innovation grants enables forward-looking budget planning with clear financial upside scenarios.
Conclusion
This examination of profit and loss dynamics across industries underscores the importance of context-sensitive financial analysis for accounting professionals. Understanding sector-specific nuances enhances advisory effectiveness and strengthens decision-making capabilities grounded in empirical evidence rather than generalized assumptions.
By developing deep familiarity with industry benchmarks, accountants gain the ability to transform routine P&L reviews into strategic catalysts for business transformation. This perspective empowers professionals to deliver exceptional value by uncovering hidden operational efficiencies and guiding clients toward sustained financial success.
News is a contributor at Accountant Log. We are committed to providing well-researched, accurate, and valuable content to our readers.